
1.5 Trends and Exports
1.5 Trends and Exports
In this lesson: you will be able to read a trend chart and export data for a report.
Recording history
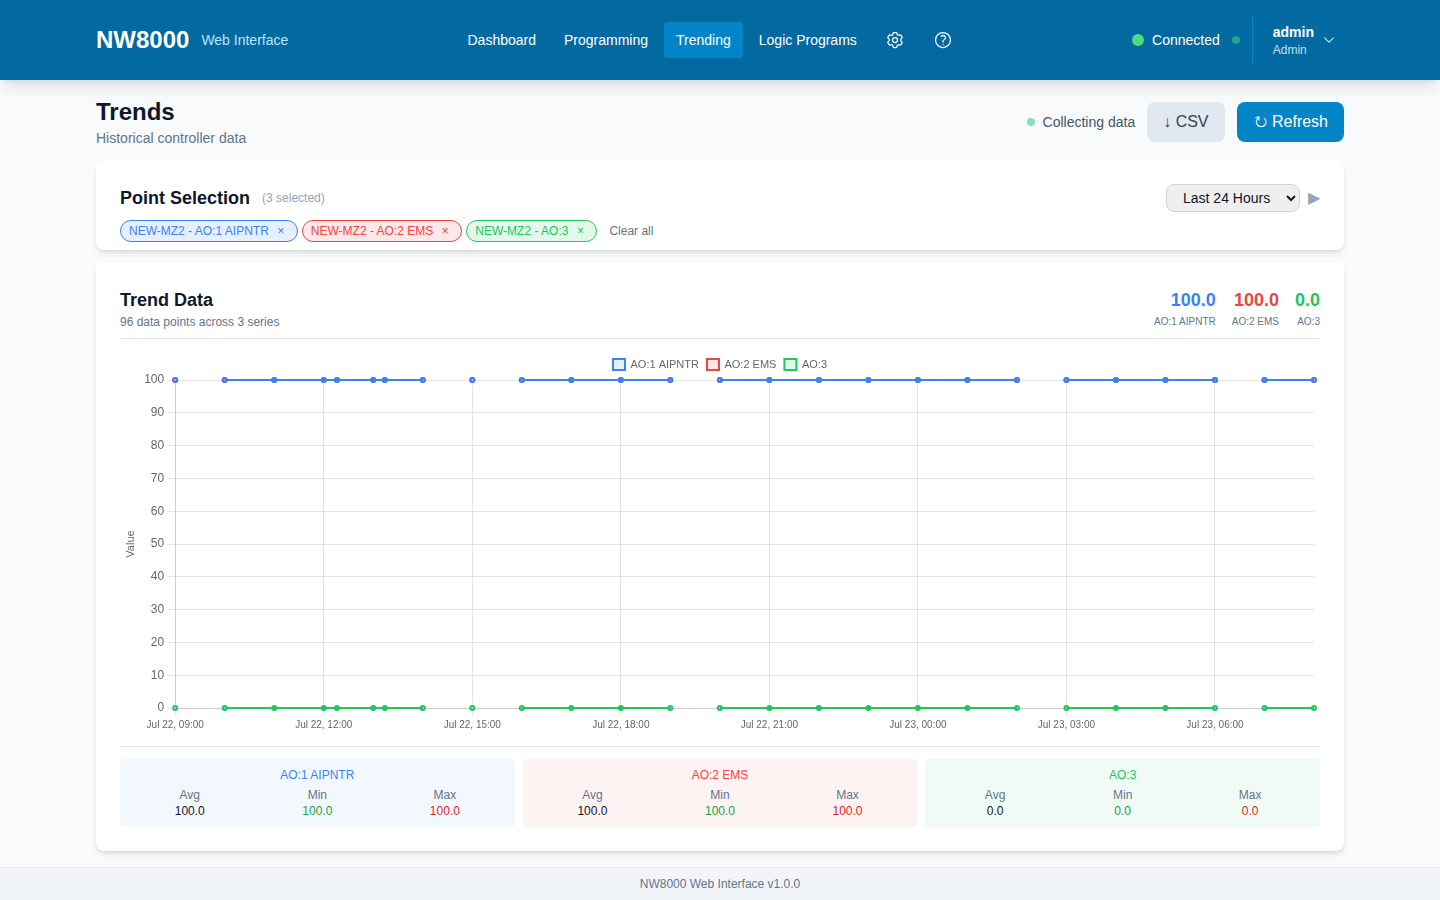
The NW8000 records the history of every point automatically, in the background, so you can always look back at how the building behaved over time — not just right now. There is nothing to set up; it is already collecting. On the Trending page you choose which of those recorded points to display: pick one or more from the list and the page draws them as a chart over the time range you select.
Reading the chart
The chart plots value against time. You can change the time range — the last hour, day, or week — to zoom in on an event or see a longer pattern. Hovering over the line shows the exact value at that moment.
This is how you answer questions like “was the supply air temperature stable overnight?” or “how often did that pump cycle?” — you look at the trend instead of watching a live number.
Exporting for a report
When you need the raw numbers — for a report, or to share with someone — use Export to CSV. That downloads the selected data as a spreadsheet file you can open in Excel.
One practical note: because every point is recorded from the start, you can trend anything at any time — nothing to enable in advance. By default the NW8000 keeps trend history for 365 days — a full year — and that retention sets how far back you can look. An administrator can change it under Settings → Data Retention.
Key points
- Every point is recorded automatically in the background — you do not enable trending per point.
- On the Trends page you choose which recorded points to display on the chart.
- The chart plots value against time; change the range and hover for exact values.
- Export to CSV gives you the raw numbers for the selected points.
- History is kept 365 days (one year) by default; an admin can change it in Settings → Data Retention.
Check your understanding
- Do you have to turn on recording for a point before you can trend it?
- You need the raw trend numbers for a report. What do you do?