
1.3 The Dashboard
1.3 The Dashboard
In this lesson: you will be able to read the Dashboard at a glance — what is healthy, what is not, and what is overridden.
Your home base
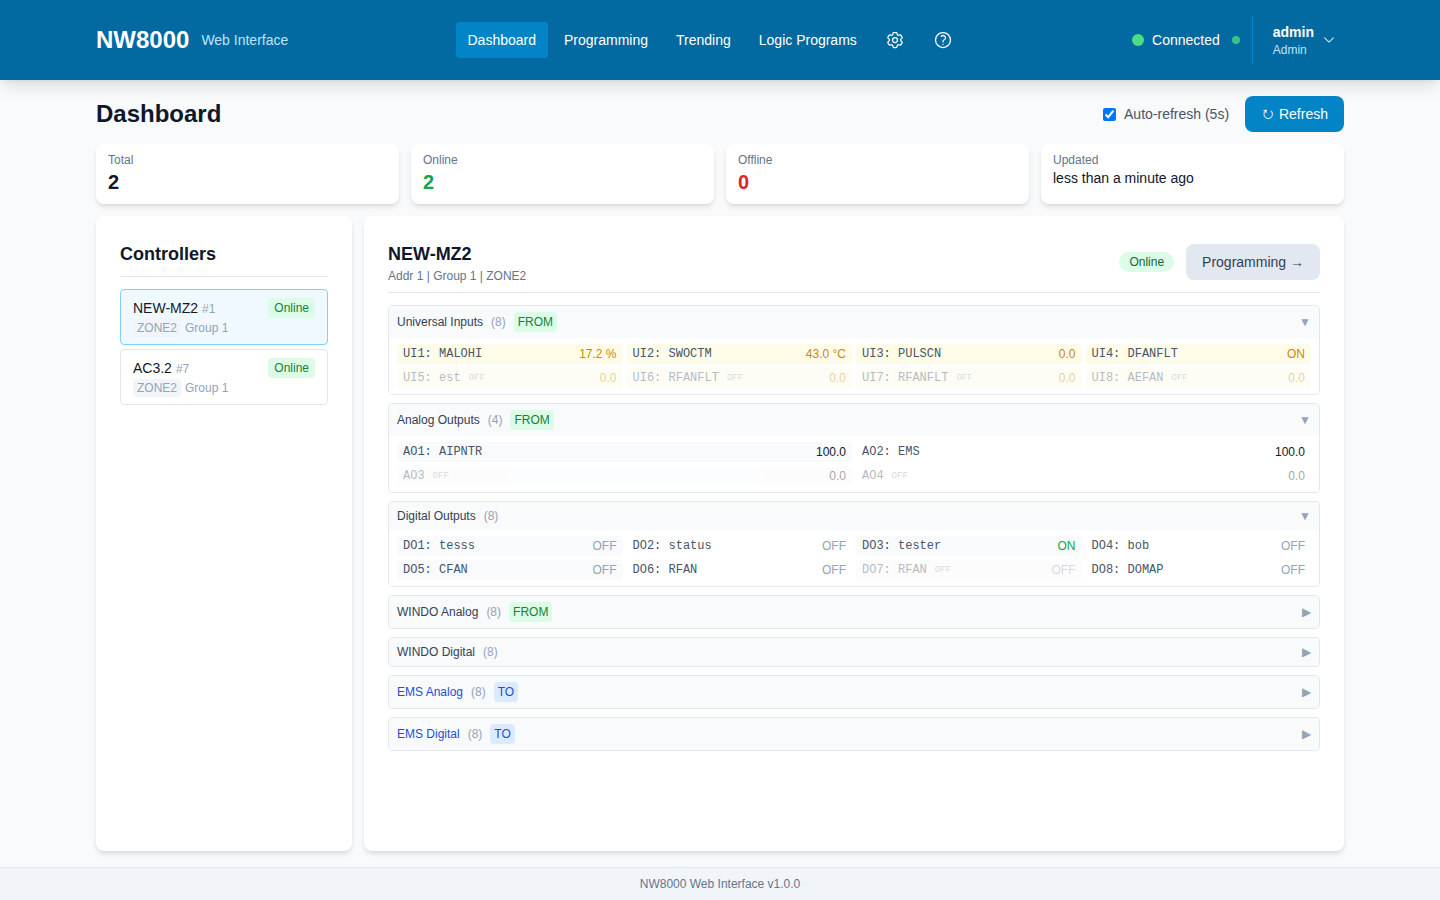
The Dashboard is your home base — a live overview of every controller the gateway is talking to. Across the top is a status bar: how many controllers there are in total, how many are online right now, and when data was last refreshed. Data updates automatically every few seconds.
Reading the controller tiles
Each controller is a tile showing its name and its key live values. A green indicator means it is online and responding. If a controller goes offline — a comms fault, or it is powered down — its tile shows that clearly, so you can spot a problem at a glance.
Notice that the controller names include the bus address, like “AC 3.2 · #7.” That address is unique, so even two identically-named controllers are easy to tell apart.
The override banner
If anyone has placed a manual override anywhere in the system, an amber banner appears at the top: “Manual overrides active.” That is important — it means something is being forced by hand rather than running automatically. Overrides are covered shortly.
Click any tile to open that controller and see all of its points in detail.
Key points
- The status bar shows total controllers, how many are online, and the last refresh time; data refreshes automatically every few seconds.
- A green indicator means online; an offline controller is shown clearly on its tile.
- The bus address in the name (e.g. “· #7”) makes each controller unique even if names match.
- An amber “Manual overrides active” banner means something is being forced by hand, not running automatically.
- Click a tile to open a controller's full detail.
Check your understanding
- Where do you look to see how many controllers are online right now?
- An amber “Manual overrides active” banner appears. What does it tell you?
- How can you tell two controllers apart if they share a name?